

McKinsey Urban World
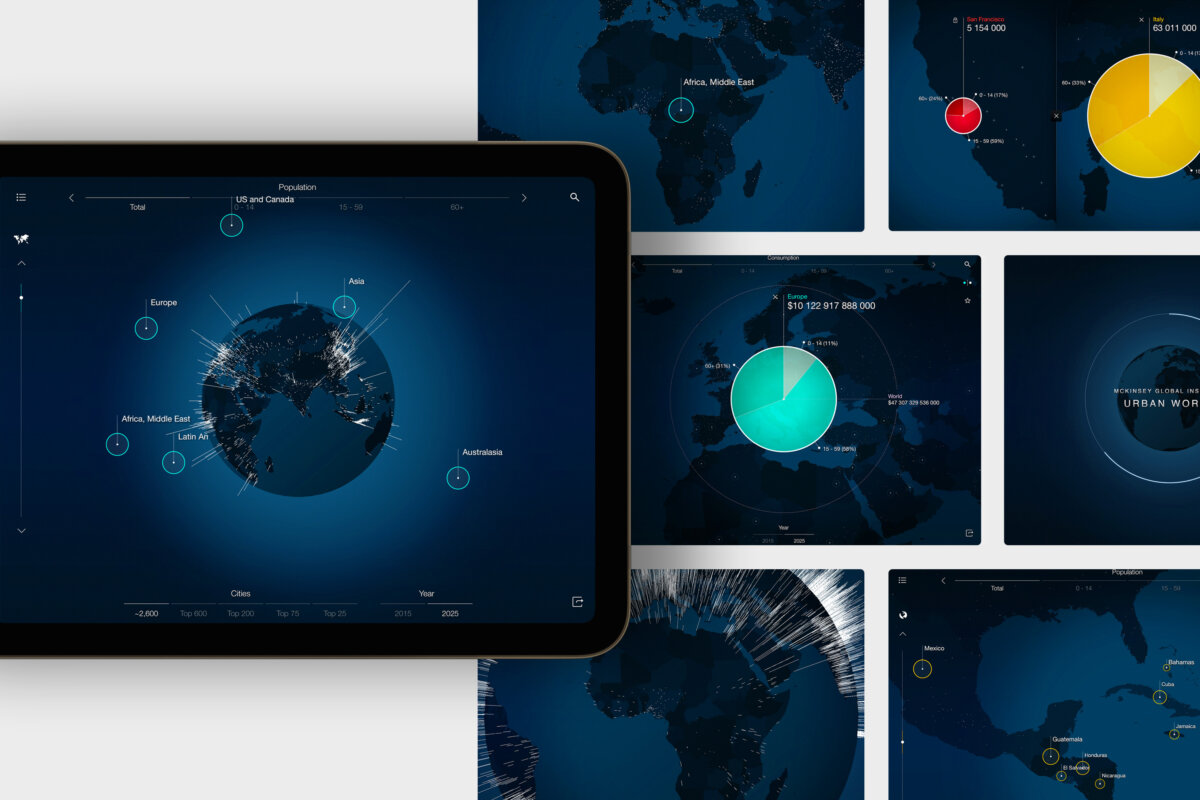
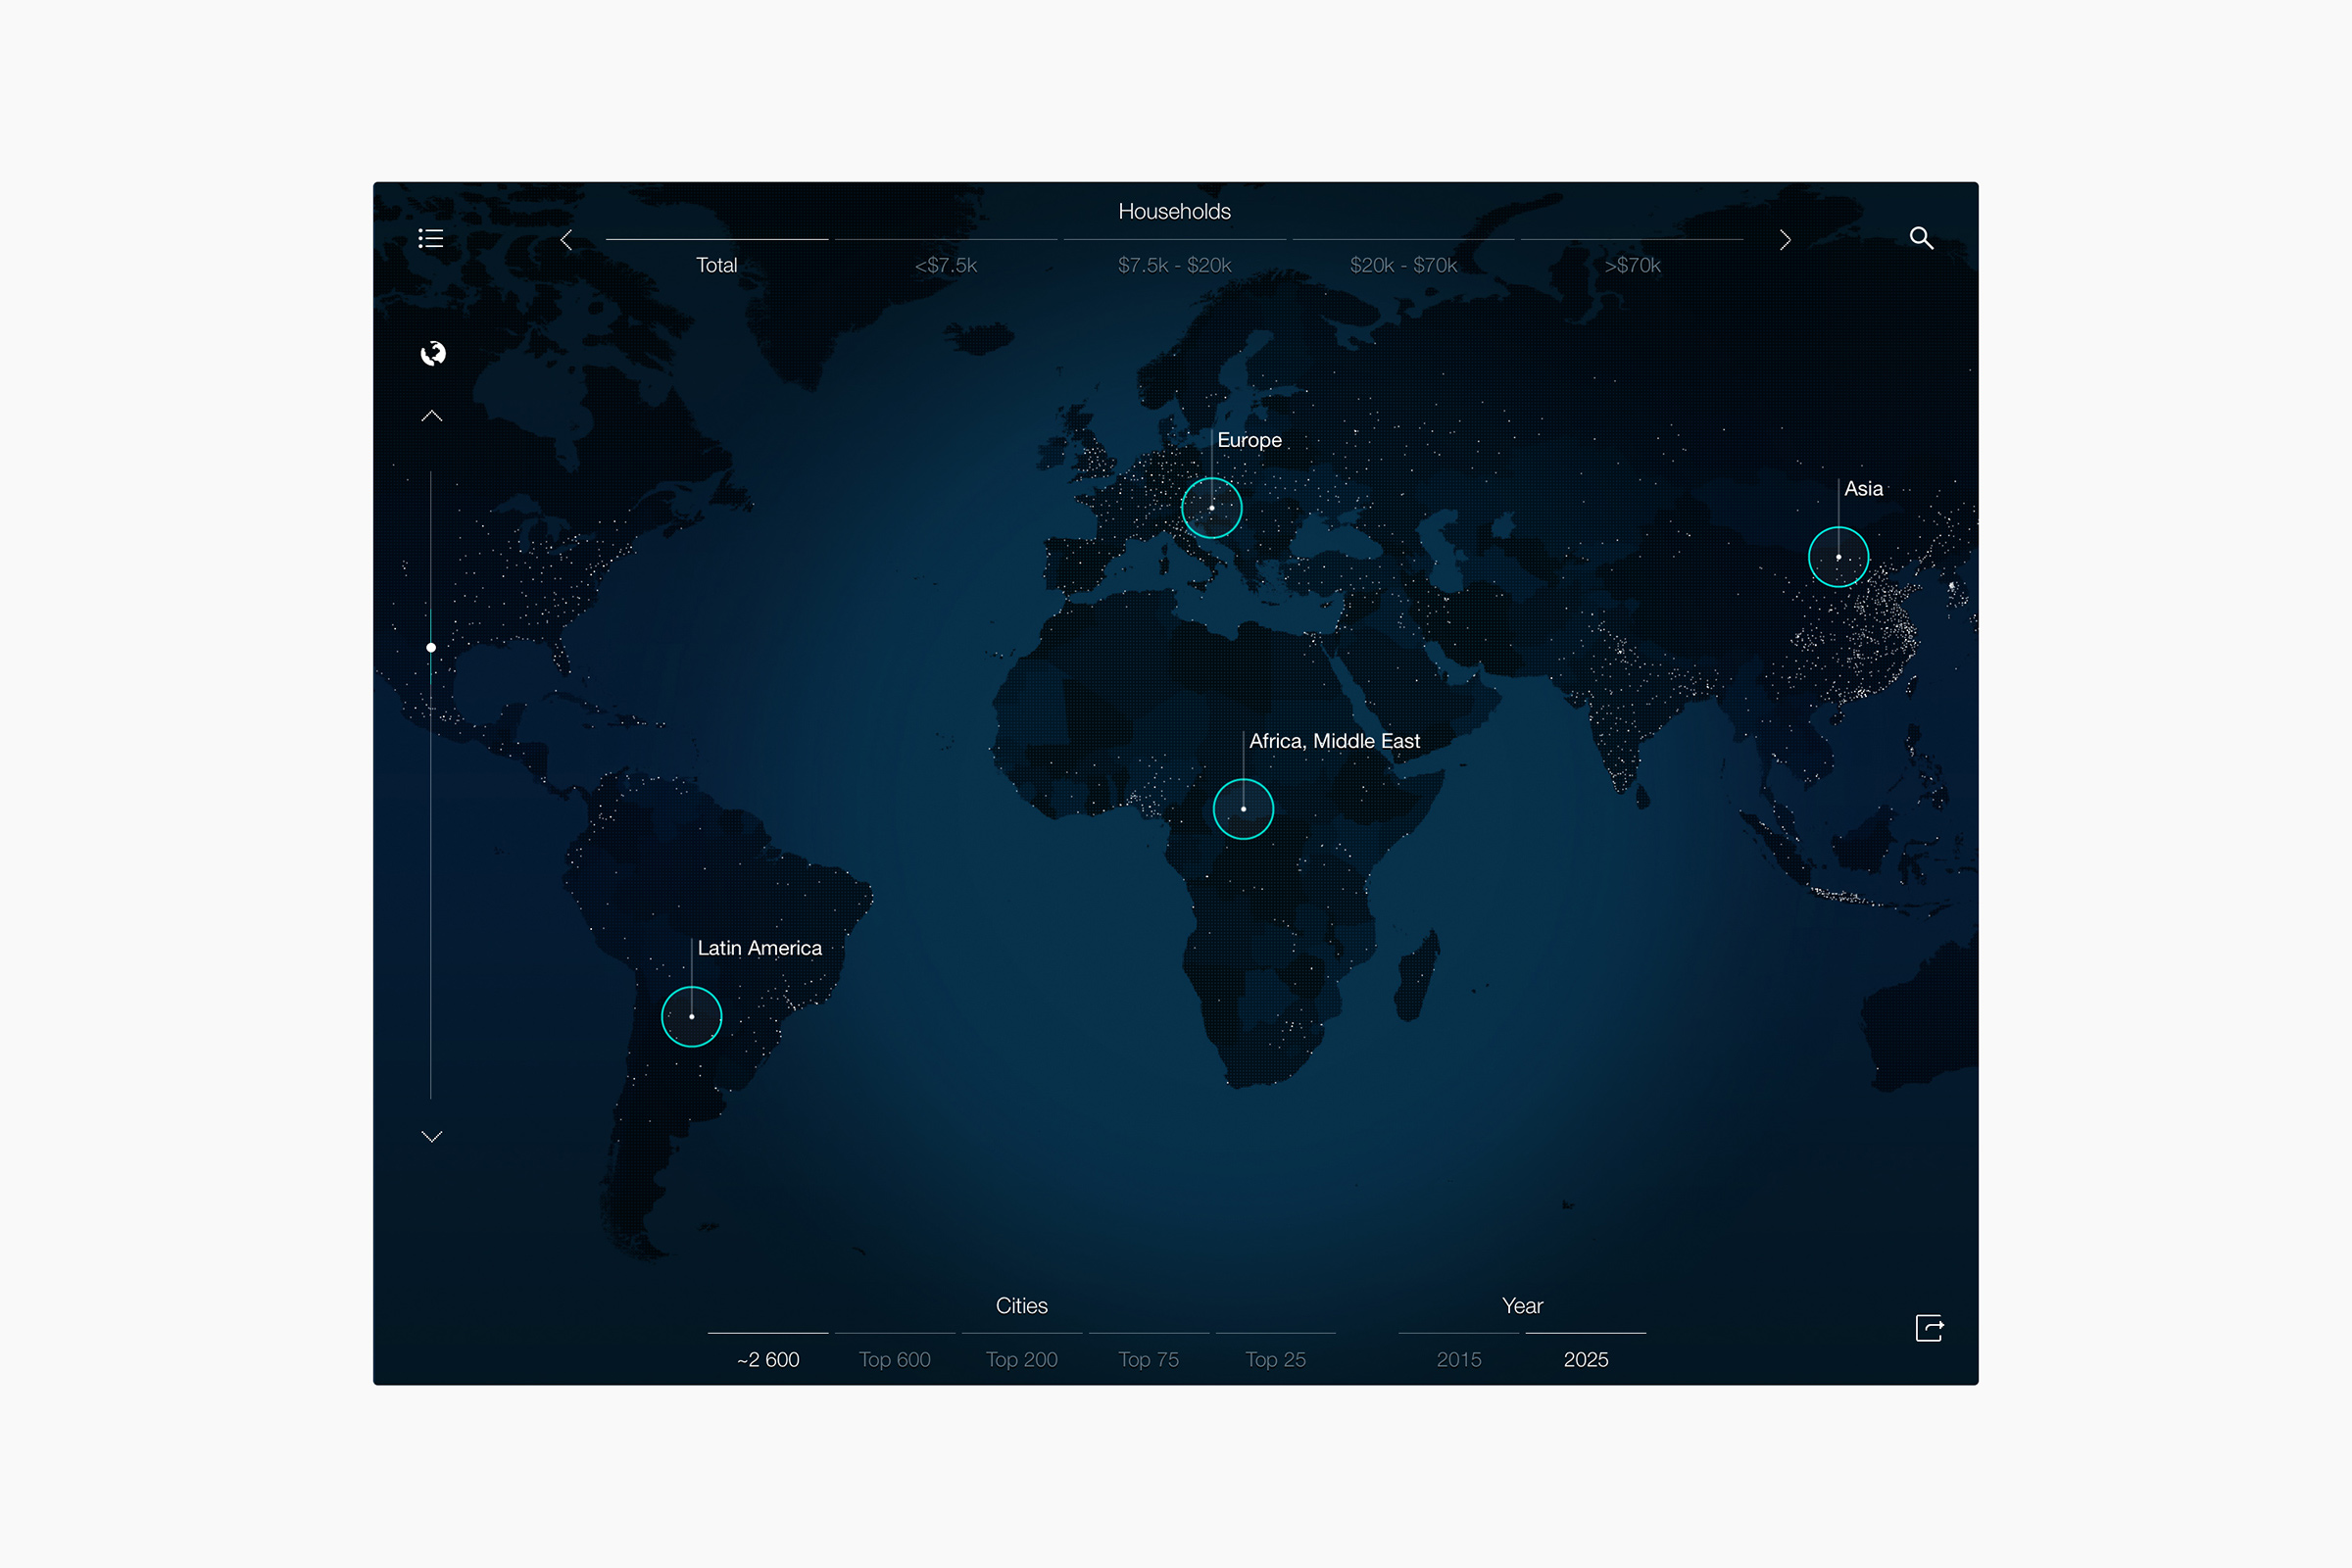
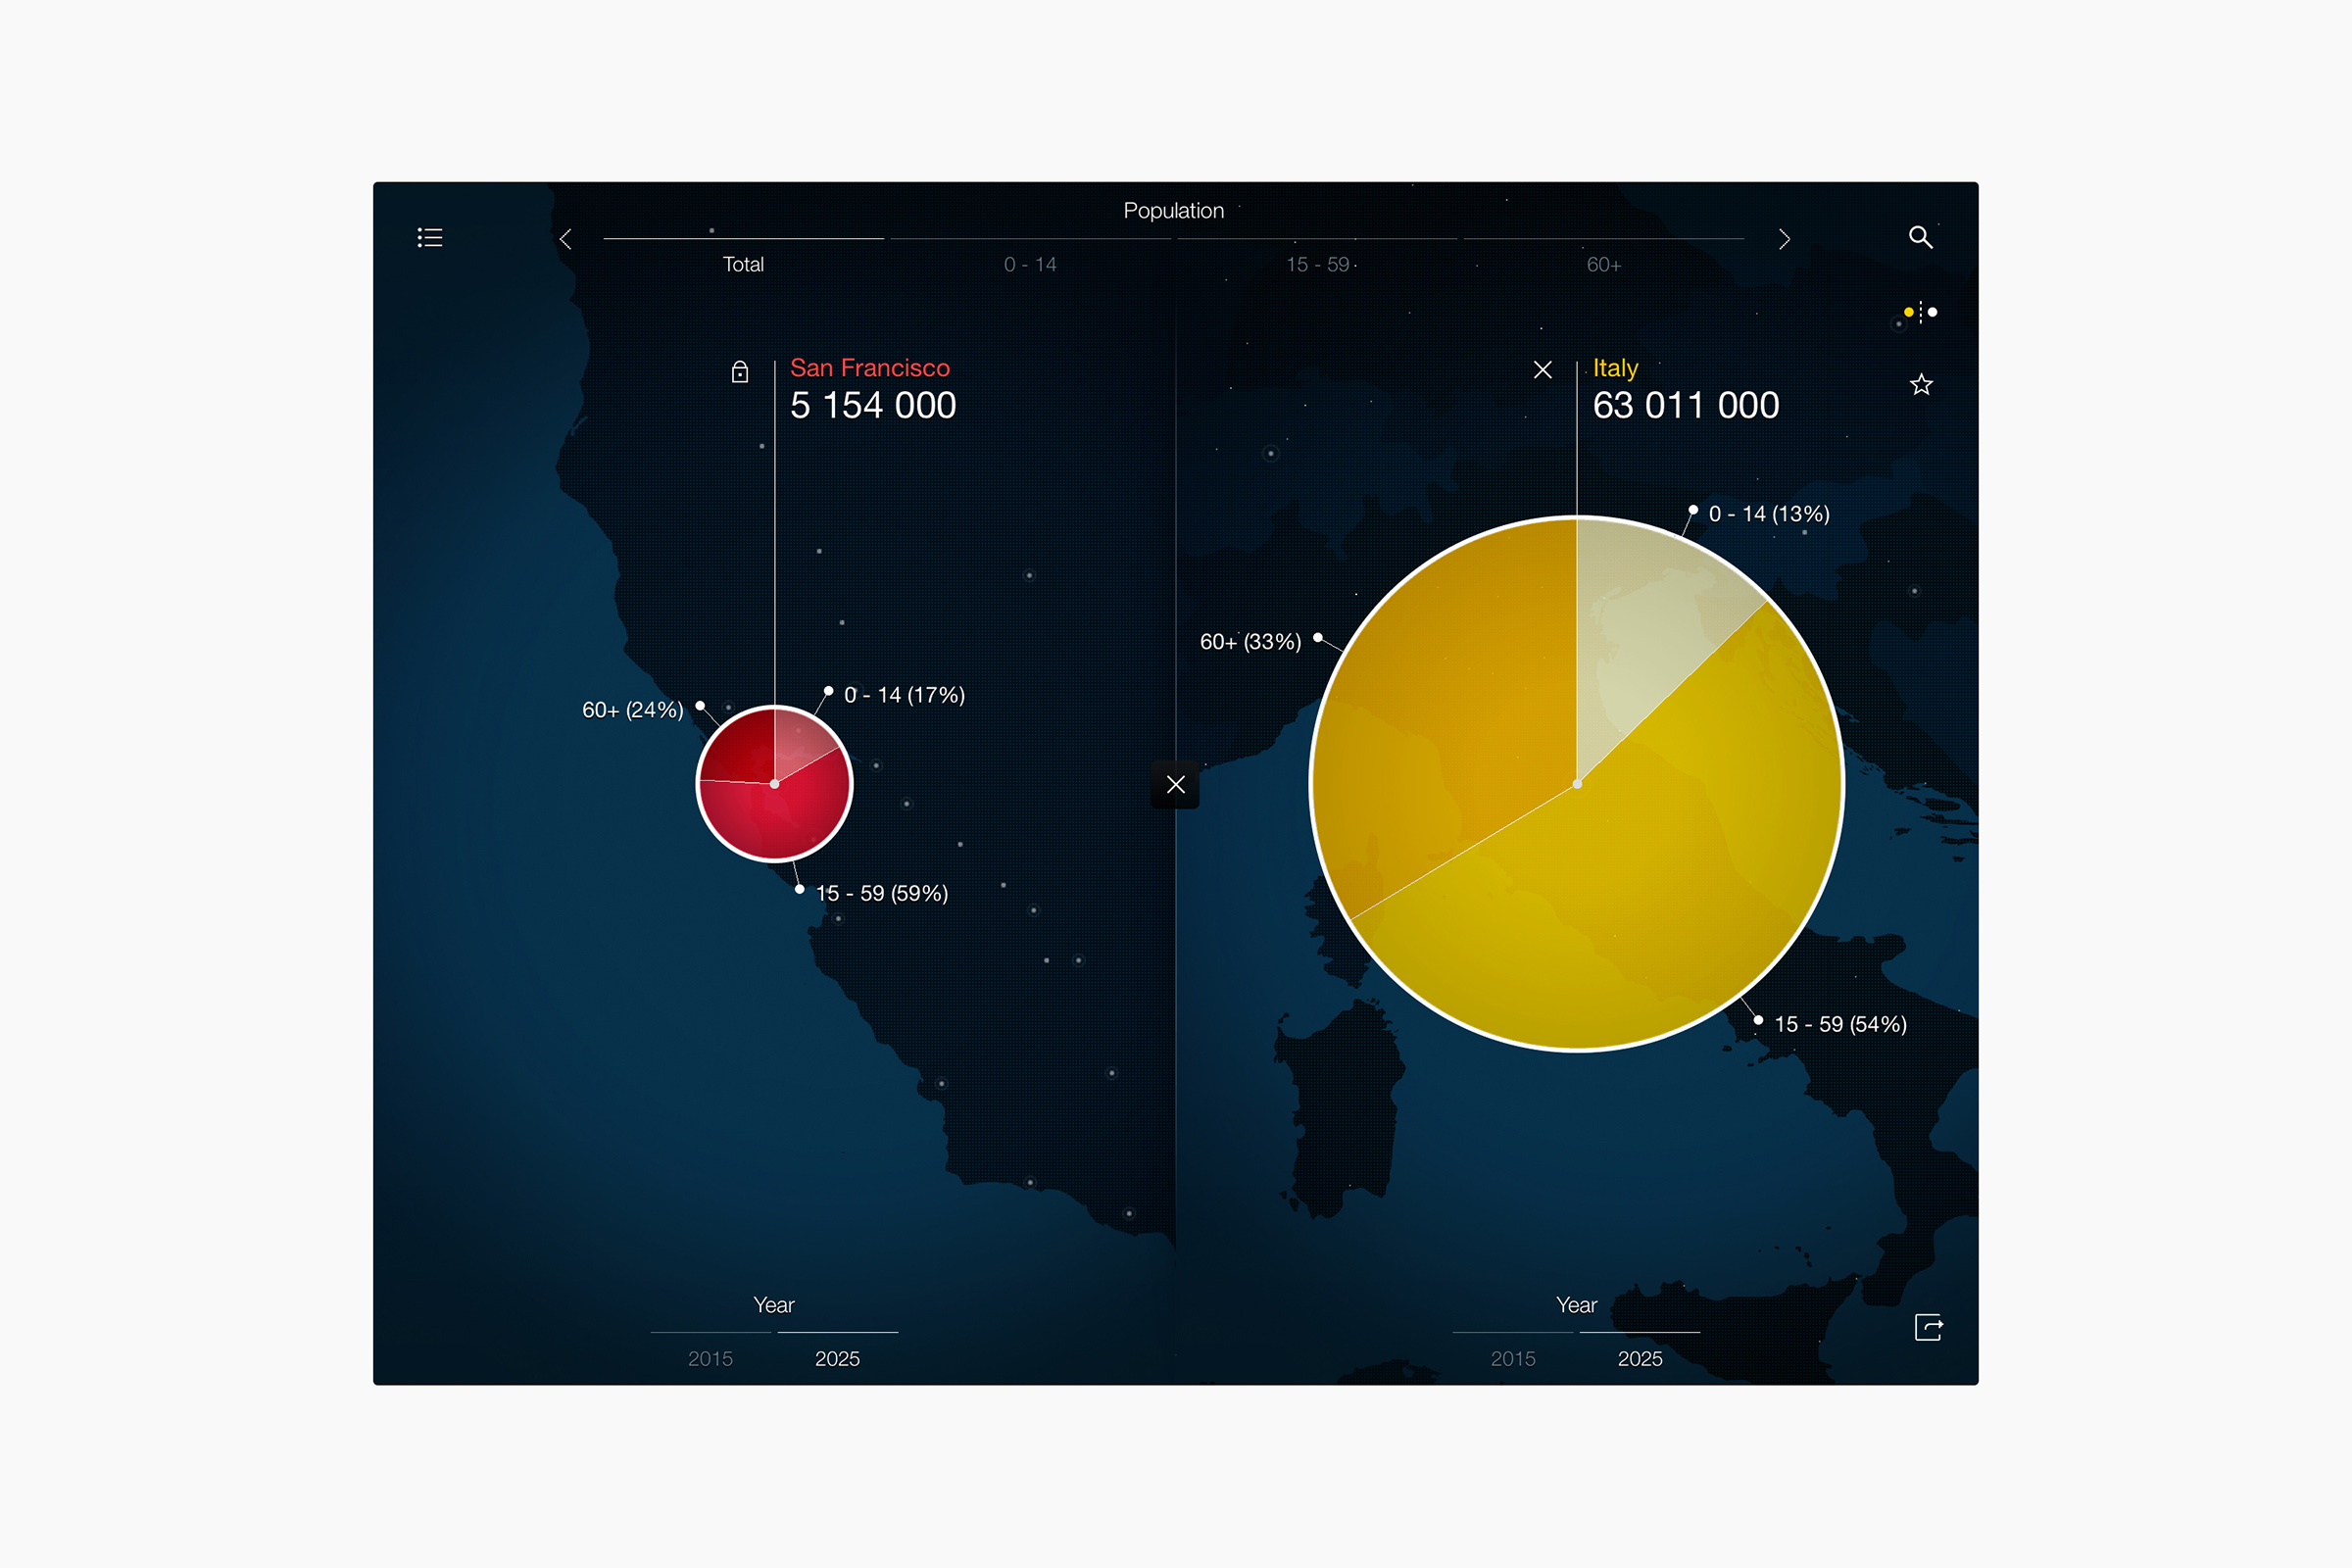
The project transforms a vast dataset of over 100,000 data points into an engaging platform that illustrates the economic growth of cities – tracking their past, present, and future trajectories.
The McKinsey Global Institute (MGI) conducted a five-year study, gathering detailed information on GDP, population, and household income from over 2,600 cities worldwide. The challenge was to take this extensive research and present it in a way that anyone could easily explore on both tablets and mobile devices. The project began with defining key features and mapping out user flows. A wireframe prototype was created early on, used to refine the user experience —ensuring smooth navigation from a spinning globe view to detailed searches, comparisons, and the ability to save favorite cities.
Building on the wireframes, the design took cues from NASA’s satellite photography. Deep blue tones and clusters of light formed the backdrop, while the data was highlighted using a bright and contrasting color palette. This approach ensured the interface was not only visually appealing but also easy to interact with and understand.
• Kantar Information is Beautiful Awards 2013- Winner
• Lovie Awards 2013 – Education – Silver
• Lovie Awards 2013 – People’s Choice – Gold
Agency: Sennep
Product owner: Stuart Jackson
Creative director: Matt Rice
Ux & Ui designer: Gra Monteleone
Technical director: Christoph Lorenzi
App developer: Alistair Mills
